
How fast is your internet really? Not what your ISP promises — what you’re actually getting, right now, at 3 PM on a Tuesday when everyone in the county is online? If you’re on rural internet — whether that’s Starlink, fixed wireless, cellular, or DSL — the answer might surprise you. And the only way to know for sure is to test it. Automatically. Over time.
In this guide, I’ll show you how to set up Ookla’s official Speedtest CLI on a Raspberry Pi or any Linux machine to run automated speed tests every hour, log the results, and build a history you can use to troubleshoot problems, track trends, or hold your ISP accountable.
Why Automated Speed Testing Matters for Rural Users
Rural internet connections are inherently variable. Starlink speeds swing with congestion and weather. Fixed wireless degrades with tree growth and atmospheric conditions. DSL performance depends on distance from the DSLAM. And cellular connections fluctuate with tower load throughout the day.
Running a single speed test tells you almost nothing. Running one every hour for a month tells you everything:
- ISP accountability — Paying for 100 Mbps but consistently getting 30? Now you have the data to prove it
- Starlink tracking — See exactly how speeds vary by time of day, weather, and season
- Troubleshooting — Sudden speed drops become obvious in your logs, helping you pinpoint when problems started
- Plan optimization — Discover your peak and off-peak hours to schedule large downloads and updates
- Provider comparison — Thinking about switching? Test your current service first so you have a real baseline
What You’ll Need
- Raspberry Pi (any model with Ethernet) — A Pi 4 or Pi 5 is ideal. Raspberry Pi 5 Starter Kit on Amazon
- Ethernet connection — Always test over Ethernet for consistent results. WiFi adds too much variability. USB-C to Ethernet Adapter on Amazon
- MicroSD card (32GB+) — Samsung EVO Select 64GB on Amazon
- Raspberry Pi OS (Lite is fine — no desktop needed)
Already have a Pi running Pi-hole or another service? Perfect — Speedtest CLI is lightweight enough to run alongside other applications without any issues.
Installing Ookla’s Official Speedtest CLI
Important: There’s an old Python-based speedtest-cli that floats around in tutorials. Don’t use it — it’s inaccurate and unmaintained. Ookla’s official Speedtest CLI uses the same engine as speedtest.net and gives reliable, consistent results.
SSH into your Pi and run these commands:
# Install dependencies
sudo apt-get install -y curl apt-transport-https gnupg

# Add Ookla's repository
curl -s https://packagecloud.io/install/repositories/ookla/speedtest-cli/script.deb.sh | sudo bash

# Install speedtest
sudo apt-get install -y speedtest
Run it once manually to accept the license and verify it works:
speedtestYou’ll see output showing your download speed, upload speed, latency, and the server used. Accept the license when prompted (first run only).
Setting Up Automated Testing with Cron
Now let’s automate it. We’ll create a simple script that runs a speed test and logs the results to a CSV file.
Create the Test Script
mkdir -p ~/speedtest-logs
nano ~/speedtest-logs/run-speedtest.sh
Paste the following:
#!/bin/bash
# Automated speed test logger
LOGFILE="$HOME/speedtest-logs/speedtest-results.csv"

# Create header if file doesn't exist
if [ ! -f "$LOGFILE" ]; then
    echo "timestamp,server_name,server_id,latency_ms,jitter_ms,download_mbps,upload_mbps,packet_loss,result_url" > "$LOGFILE"
fi

# Run speedtest with CSV-friendly JSON output
RESULT=$(speedtest --format=json --accept-license --accept-gdpr 2>/dev/null)

if [ $? -eq 0 ]; then
    TIMESTAMP=$(echo "$RESULT" | jq -r '.timestamp')
    SERVER=$(echo "$RESULT" | jq -r '.server.name')
    SERVER_ID=$(echo "$RESULT" | jq -r '.server.id')
    LATENCY=$(echo "$RESULT" | jq -r '.ping.latency')
    JITTER=$(echo "$RESULT" | jq -r '.ping.jitter')
    DOWNLOAD=$(echo "$RESULT" | jq -r '.download.bandwidth' | awk '{printf "%.2f", $1 * 8 / 1000000}')
    UPLOAD=$(echo "$RESULT" | jq -r '.upload.bandwidth' | awk '{printf "%.2f", $1 * 8 / 1000000}')
    PACKET_LOSS=$(echo "$RESULT" | jq -r '.packetLoss // "N/A"')
    URL=$(echo "$RESULT" | jq -r '.result.url')

    echo "$TIMESTAMP,$SERVER,$SERVER_ID,$LATENCY,$JITTER,$DOWNLOAD,$UPLOAD,$PACKET_LOSS,$URL" >> "$LOGFILE"
fi
Make it executable and install jq for JSON parsing:
chmod +x ~/speedtest-logs/run-speedtest.sh
sudo apt-get install -y jq
Schedule with Cron
Open your crontab:
crontab -eAdd this line to run a test every hour:
0 * * * * /home/pi/speedtest-logs/run-speedtest.shWant more granularity? Test every 30 minutes instead:
0,30 * * * * /home/pi/speedtest-logs/run-speedtest.shAnalyzing Your Results
After a few days of testing, your CSV file will be filled with data. Here are several ways to use it:
Quick Terminal Analysis
# View the last 10 tests
tail -10 ~/speedtest-logs/speedtest-results.csv | column -t -s ','

# Find your fastest download speed
sort -t',' -k6 -n ~/speedtest-logs/speedtest-results.csv | tail -1

# Calculate average download speed
awk -F',' 'NR>1 {sum+=$6; n++} END {print "Average: " sum/n " Mbps"}' ~/speedtest-logs/speedtest-results.csv
Spreadsheet Visualization
Copy the CSV to your computer and open it in Google Sheets or Excel. Create a line chart with timestamp on the X-axis and download/upload speeds on the Y-axis. You’ll immediately see patterns — peak congestion times, overnight recovery, weather-related drops, and more.
Advanced: Grafana Dashboard
For the data nerds (no judgment — I’m one too), you can pipe results into InfluxDB and visualize with Grafana for a real-time dashboard. The speedtest-exporter project makes this straightforward if you’re already running a monitoring stack.
Alternatives Worth Knowing
Ookla’s CLI is the gold standard, but a couple of alternatives are worth mentioning:
- Netflix fast.com CLI (
fast) — Tests against Netflix servers. Useful because some ISPs throttle Netflix traffic, so comparing Ookla vs. Fast can reveal throttling. Install vianpm install -g fast-cli - LibreSpeed — Self-hosted speed test. Run your own server and test internal network performance. Great for diagnosing WiFi vs. WAN bottlenecks
- iPerf3 — Not an internet speed test, but essential for testing your local network throughput between devices
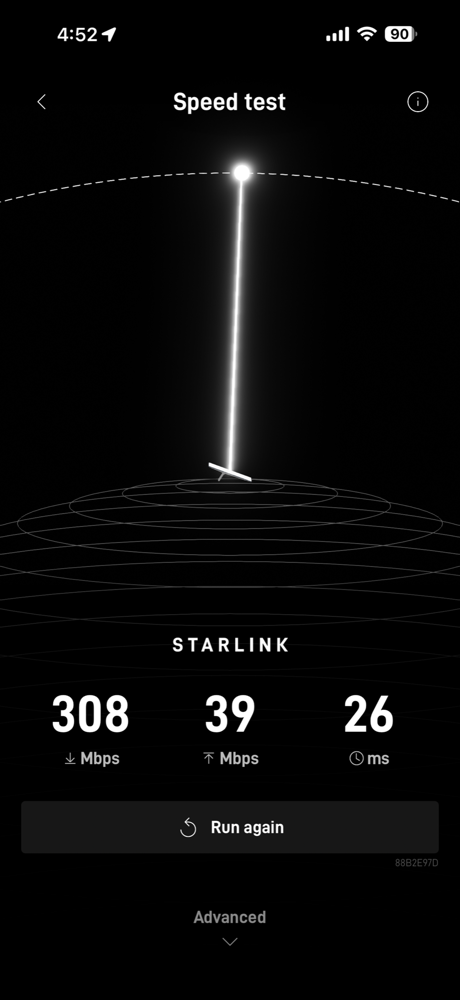
Real-World Use Case: Starlink Monitoring
If you’re a Starlink user, automated speed testing is invaluable. Starlink performance varies significantly based on:
- Time of day — Evening congestion (7-11 PM) can cut speeds dramatically in populated cells
- Weather — Heavy rain and snow cause temporary speed drops
- Satellite positioning — As the constellation grows, speeds generally improve
- Seasonal changes — Tree foliage can obstruct the dish in summer
With a month of hourly data, you’ll know exactly what your Starlink connection delivers across all conditions. That’s powerful information when deciding whether to keep it, switch providers, or optimize your setup.
Tips for Accurate Testing
- Always use Ethernet — WiFi variability will pollute your data. A USB-to-Ethernet adapter works great on Raspberry Pi
- Minimize concurrent traffic — Schedule tests during times when nobody’s streaming (or accept that your data includes real-world conditions)
- Use a consistent server — Add
--server-id=XXXXXto your script to always test against the same server for apples-to-apples comparison - Monitor data caps — Each Ookla test uses roughly 100-200 MB. If you’re on a metered connection, hourly tests use about 5 GB/month. Adjust frequency accordingly
Final Thoughts
You can’t manage what you can’t measure. For rural internet users dealing with variable connections, automated speed testing transforms vague frustrations (“my internet feels slow today”) into actionable data. Whether you’re calling your ISP, evaluating a new provider, or just optimizing when you schedule large downloads, having months of historical speed data is incredibly empowering.
Total setup time? About 20 minutes. Cost? Free if you already have a Raspberry Pi or Linux machine. The data you’ll gather is priceless.
Running speed tests on your rural connection? I’d love to hear what patterns you’ve discovered. Drop your average speeds and ISP in the comments — let’s build a picture of what rural internet really looks like across the country.